ATOCHA

Jose Luis Landet

Bio

He lives and works between Mexico City and Buenos Aires. He exhibited in important latin american institutions such as Fundación Proa (BsAs), Museo Ex Teresa de Arete Actual (CDMX), FLORA ars+natura (Bogotá) and Oaxaca Contemporary Art Museum among others.
His work can also be found in Jumex Collection, Louisiana Museum (Denmark), LACMA, Sayago & Pardon, JoAnn Gonzalez-Hickey Collection and The Brillembourg Capriles Collection, as in many collections of Argentina.

Statement

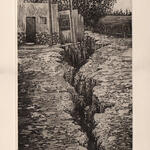
José Luis Landet artistic production can be approached by using the verb “to manifest” and its different meanings: on one hand, “manifest” can be understood as a protest act, collective and public, in which the bodies gather to demand something; on the other, it may refer to reveal or show something, to display what was lying underneath. It is right at the intersection between politics and view that Landet´s manifested landscapes emerge.

Jose Luis Landet
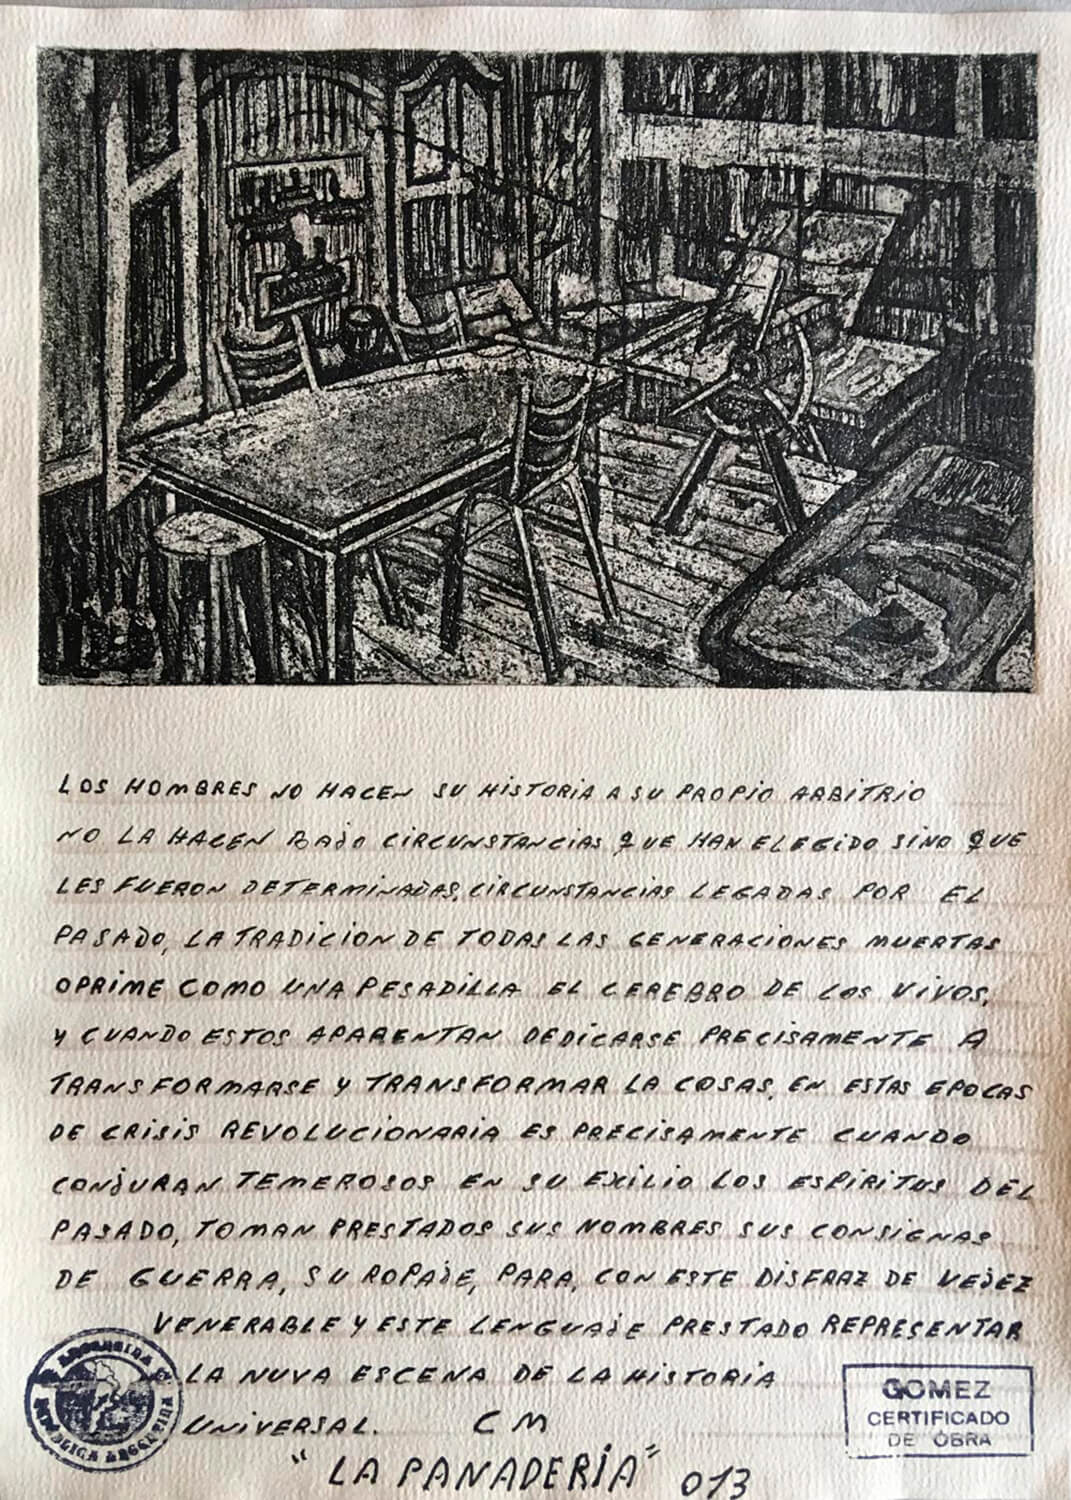
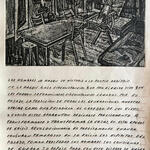
Título de la obra: La Panaderia 013
Técnica y soporte: Etching and C.G. handwriting on Gainsborough paper
Año de impresión: 07/2018
Año de la obra: 2013/2018
Medidas: 30 x 21 cm - 11.80 x 8.25 in
Edición: /20
Precio: US$ 700.00

Información adicional

Printed by Diego Bugallo in Taller La Panadería (La Boca, Buenos Aires)

Wall reference
2.5 x 4m / 98.4 x 157 in

Otros trabajos de ATOCHA

Otras galerías

Nohra Haime Gallery
Luiz Caribé Art Gallery
ICFAC: International Chinese Fine Arts Council
Galeria Caribé
Z42 Arte
Aina Nowack /AAC Galería de Arte
La Panaderia 013

eZ debug

Timing: Feb 06 2026 06:33:04
Script start
Timing: Feb 06 2026 06:33:04
Module start 'content'
Timing: Feb 06 2026 06:33:05
Module end 'content'
Timing: Feb 06 2026 06:33:05
Script end

Main resources:

Total runtime0.5028 sec
Peak memory usage9,472.0000 KB
Database Queries173

Timing points:

CheckpointStart (sec)Duration (sec)Memory at start (KB)Memory used (KB)
Script start 0.00000.0080 924.4688645.2500
Module start 'content' 0.00800.4763 1,569.71886,805.6172
Module end 'content' 0.48440.0184 8,375.3359223.8438
Script end 0.5028  8,599.1797 

Time accumulators:

 Accumulator Duration (sec) Duration (%) Count Average (sec)
Ini load
Load cache0.00260.5214180.0001
Mysql Total
Database connection0.00140.279410.0014
Mysqli_queries0.175634.91481730.0010
Looping result0.00460.92141700.0000
TS translator
TS init0.00160.325330.0005
TS cache load0.00090.177830.0003
TS context load0.00080.153030.0003
Template Total0.454990.520.2274
Template load0.00190.375520.0009
Template processing0.452990.076620.2265
Template load and register function0.00010.014710.0001
states
state_id_array0.00190.376110.0019
state_identifier_array0.00170.329720.0008
Override
Cache load0.00120.2484440.0000
Sytem overhead
Fetch class attribute can translate value0.00220.4428290.0001
Fetch class attribute name0.00150.3062370.0000
Fetch class attribute name0.00671.323590.0007
XML
Image XML parsing0.186937.1708290.0064
class_abstraction
Instantiating content class attribute0.00020.0363380.0000
General
dbfile0.184836.75191690.0011
String conversion0.00000.002830.0000
Note: percentages do not add up to 100% because some accumulators overlap

Time used to render debug report: 0.0004 secs